Intro—Project Overview
A luxury skincare brand was growing but wasting design time on wrong priorities. We reprioritized the roadmap, leading to improvements in bounce rates, cart abandonment, and user signups, proving that knowing what to design is crucial.

Glymed+ is a luxury professional skincare brand that uses a distributor business model facilitated through an e-commerce site. Every customer is connected to a licensed skincare professional who sells the products.

Role
I was a Product Design Contractor working with Glymed+. I partnered with a PM and worked directly with Glymed’s President and Vice President. I facilitated the objectives workshop, built the scoring model with the team, and designed the signup, cart, and profile improvements.
The Problem
Priorities were dictated by subjective opinions, and there was no established method of measuring the performance of Glymedplus.com.
Signup Impact
20%+ Growth in New Accounts
A clearer signup and Find a Pro flow, tracked with A/B tests.
Checkout Impact
Lower Cart Abandonment
An anonymous cart and a streamlined checkout made ordering easier.
00—Where we started
As a contract designer for Glymed+, I had just 10 hours a week to make an impact. I was working through the feature roadmap, but one question kept coming up: was I spending that time on the features that would deliver the most value to the client?
Low Hanging Fruit
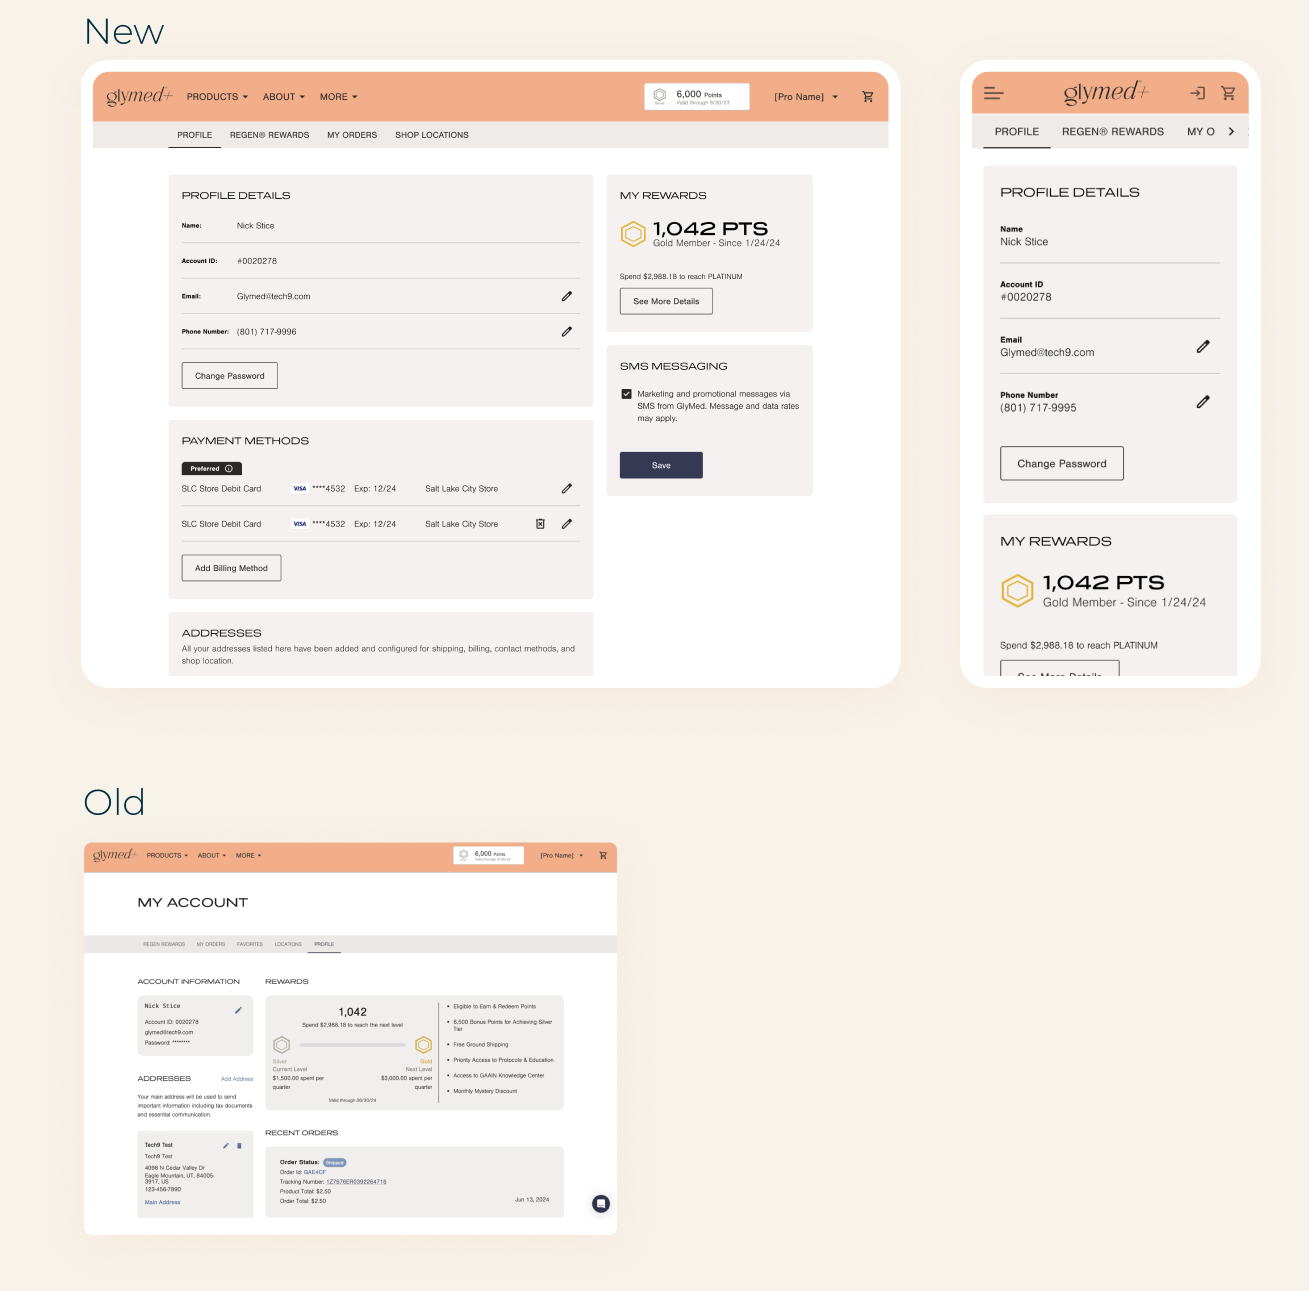
Settings & Reward Details
The settings page was low-hanging fruit. Its editing paradigms and hierarchy did not represent the purpose of the page. I applied common usability practices and known mental models to redesign the page, focusing on these things:
- Hierarchy
- Editing paradigms
- Organization
- Sub navigation improvements
Without established KPIs, I couldn’t prove that this redesign was valuable.
Was I making the most impact possible?
01—Establish KPIs
It was hard to know what was working and what wasn’t without measuring the performance of the site. I worked with the PM and engineering to establish tracking hooks and an analytics tool.
Benchmarking
Quantitative Performance Data
Quantitative data provides a measurable baseline for evaluating performance, which was essential for the A/B testing that followed.
KPIs established for measurement:
- Conversion
- Acquisitions
- Retention
- Bounce rates
- Cart abandonment
- Scrolling depth
Beauty Industry Benchmark
Purchase conversion
2.5%
25 purchases / 1,000 sessions
Cart Abandonment
75%
750 abandoned / 1,000 carts
H&B retention (2024)
41.2%
Industry benchmarks, not site results
02—Align On Business Objectives
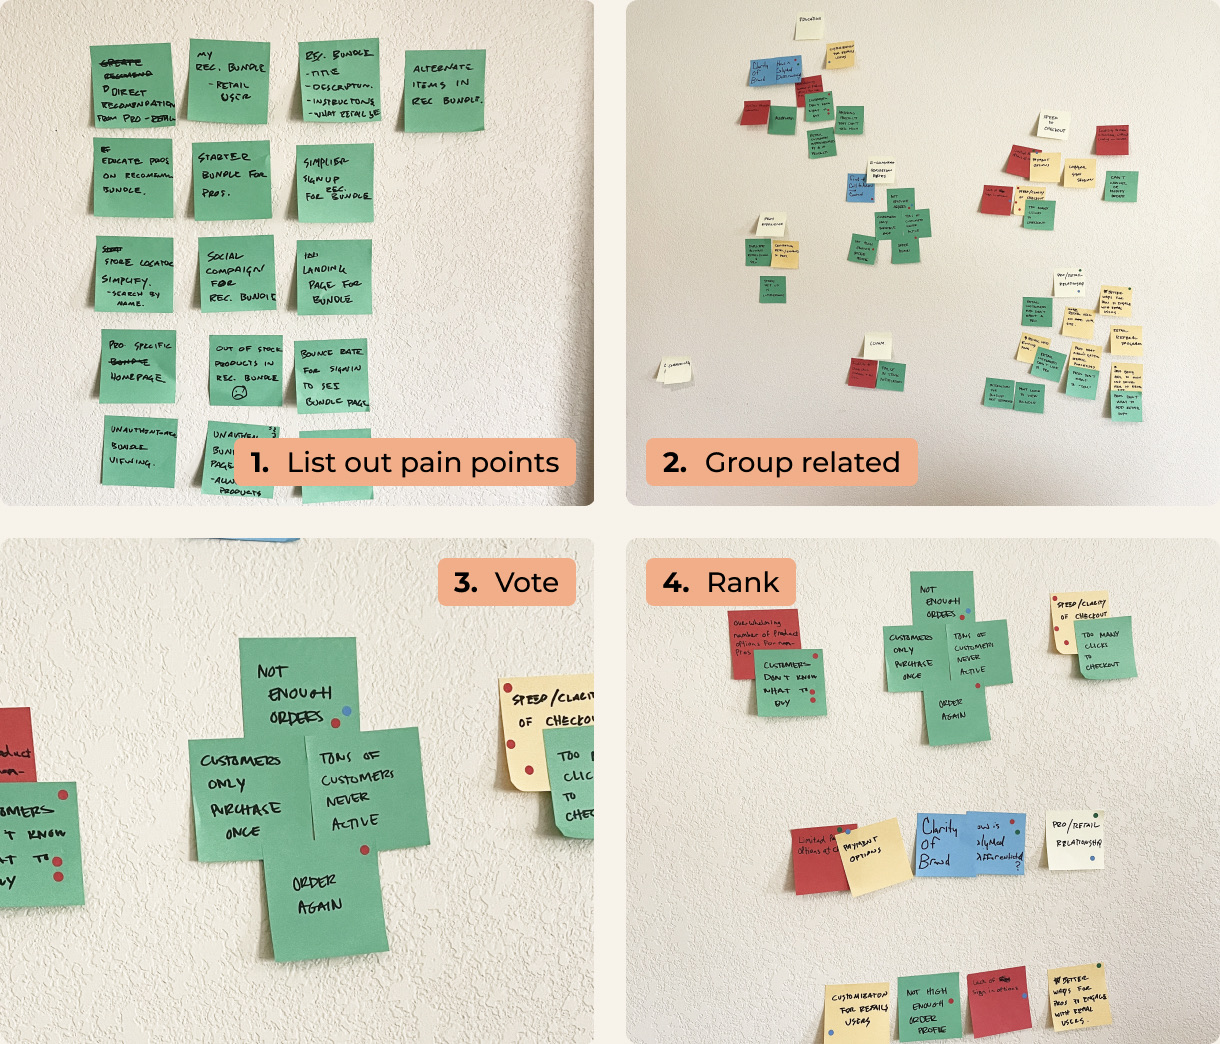
I ran a small off-site workshop with the President, Vice President, and Product Owner, using an affinity map to surface the biggest pain points, which we converted into objectives.
Workshop
Affinity Mapping With Leadership
Working with the team, we listed out all pain points. These came from customer reviews, complaints from distributors, business needs, and KPIs that were underperforming.
In identifying groupings, we worked to discover common themes, not just related items or duplicates.
We voted on significant themes that seemed most impactful. The vote was essential for getting consensus on the objectives.
The highest-ranking themes became the objectives.
Objectives—The 3 Objectives We Chose
As a team, we identified three major themes that became our objectives. They were based on the biggest pain points we identified for the platform. Objectives commonly align with these 3 KPIs: acquisition, adoption, and retention.

Product Education
Product discovery was low; customers relied on distributors to add items. Shoppers needed help understanding products and their benefits. High bounce rates on product pages indicated shoppers needed clarity before buying.
High bounce rates & low conversion & discovery

Ease of Ordering
The checkout flow was complicated and required users to sign in. There was no cart caching, and checkout was not anonymous.
Cart abandonment & reorder rate

Distribution Clarity
A complex distribution model was not conventional and the mental model was hard to grasp from the UI. Every customer has to be associated with a Pro. The Add a Pro step in signup had a high bounce rate.
Find a Pro bounce rate & signup abandonment
03—Prioritizing the Roadmap
With the objectives set, the next step was a scoring method to rank each feature by the impact it would make.
Prioritization Framework
Scoring the Roadmap
Each roadmap item got a t-shirt size score for each of the three objectives, based on how much it would move that objective.
We added the scores together, and the totals became the new priority order.
Glymed+ Roadmap
Rank
Feature
Product Education
Ease of Ordering
Distribution Clarity
5
Distributors recommendation
8
0
0
Proposed scores 2 = Low | 4 = Moderate | 8 = High alignment
Focus on business initiatives, and replace opinions with a score to prioritize the roadmap.
04—What We Prioritized
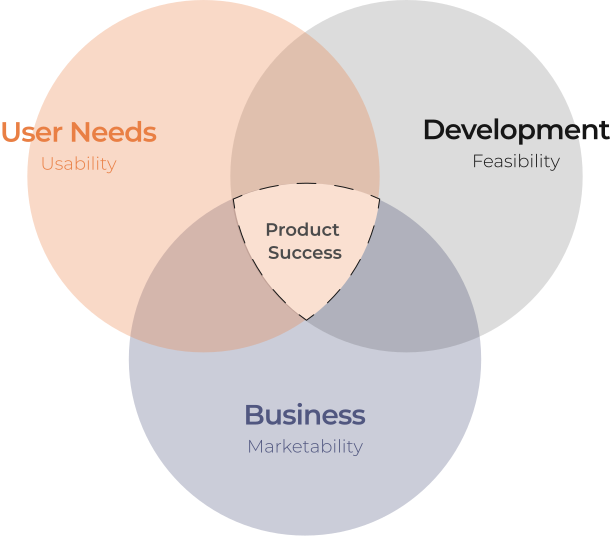
A good product team balances three needs: user needs, business needs, and development needs. Once the roadmap followed our objectives, we shipped UI changes against them and used A/B tests through a CRO tool to find the best solutions.
Distribution Clarity
Clearer Signup
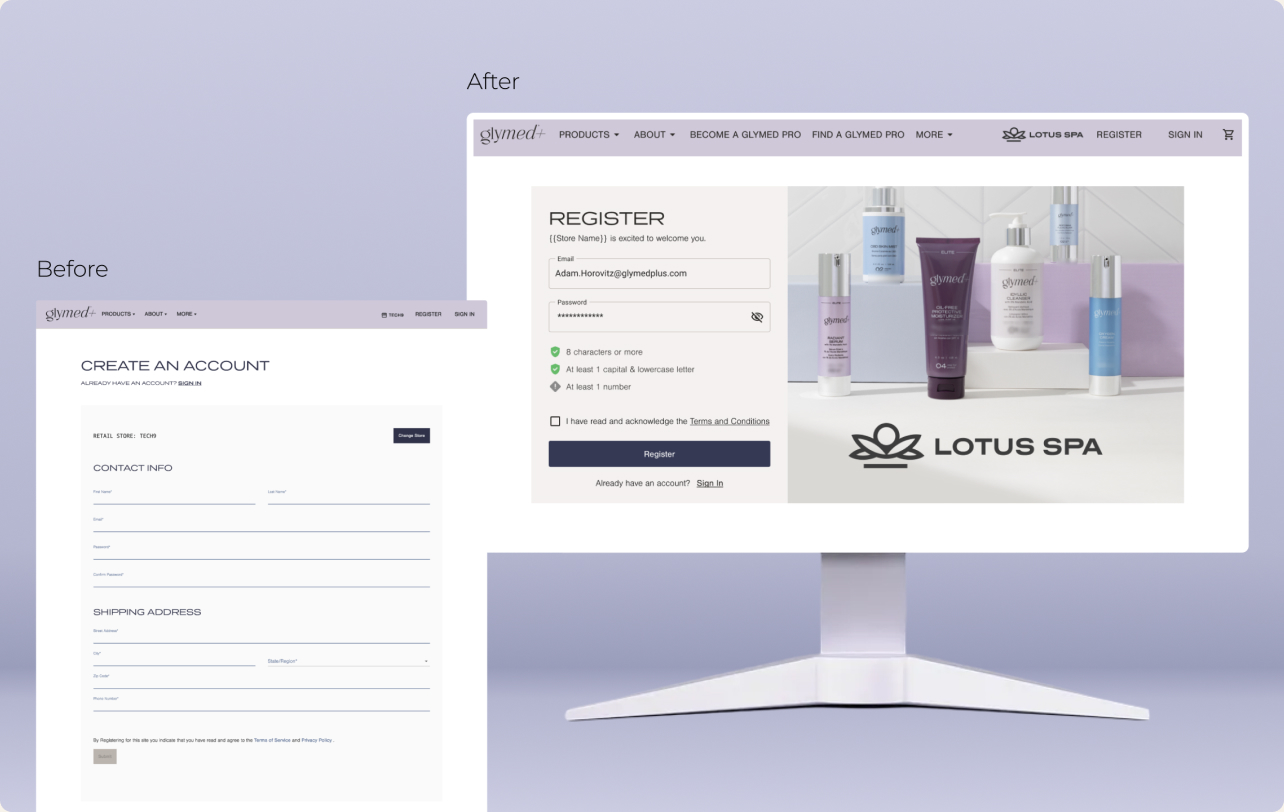
The long form of the original signup page had a high bounce rate. It was also clear from customer feedback that they didn’t know if they were signing up under the right distributor. So I focused on:
- Reduced input fields to lower cognitive load
- Created a place for distributor branding
- Microcopy and password requirements
Distribution Clarity
Find a Pro
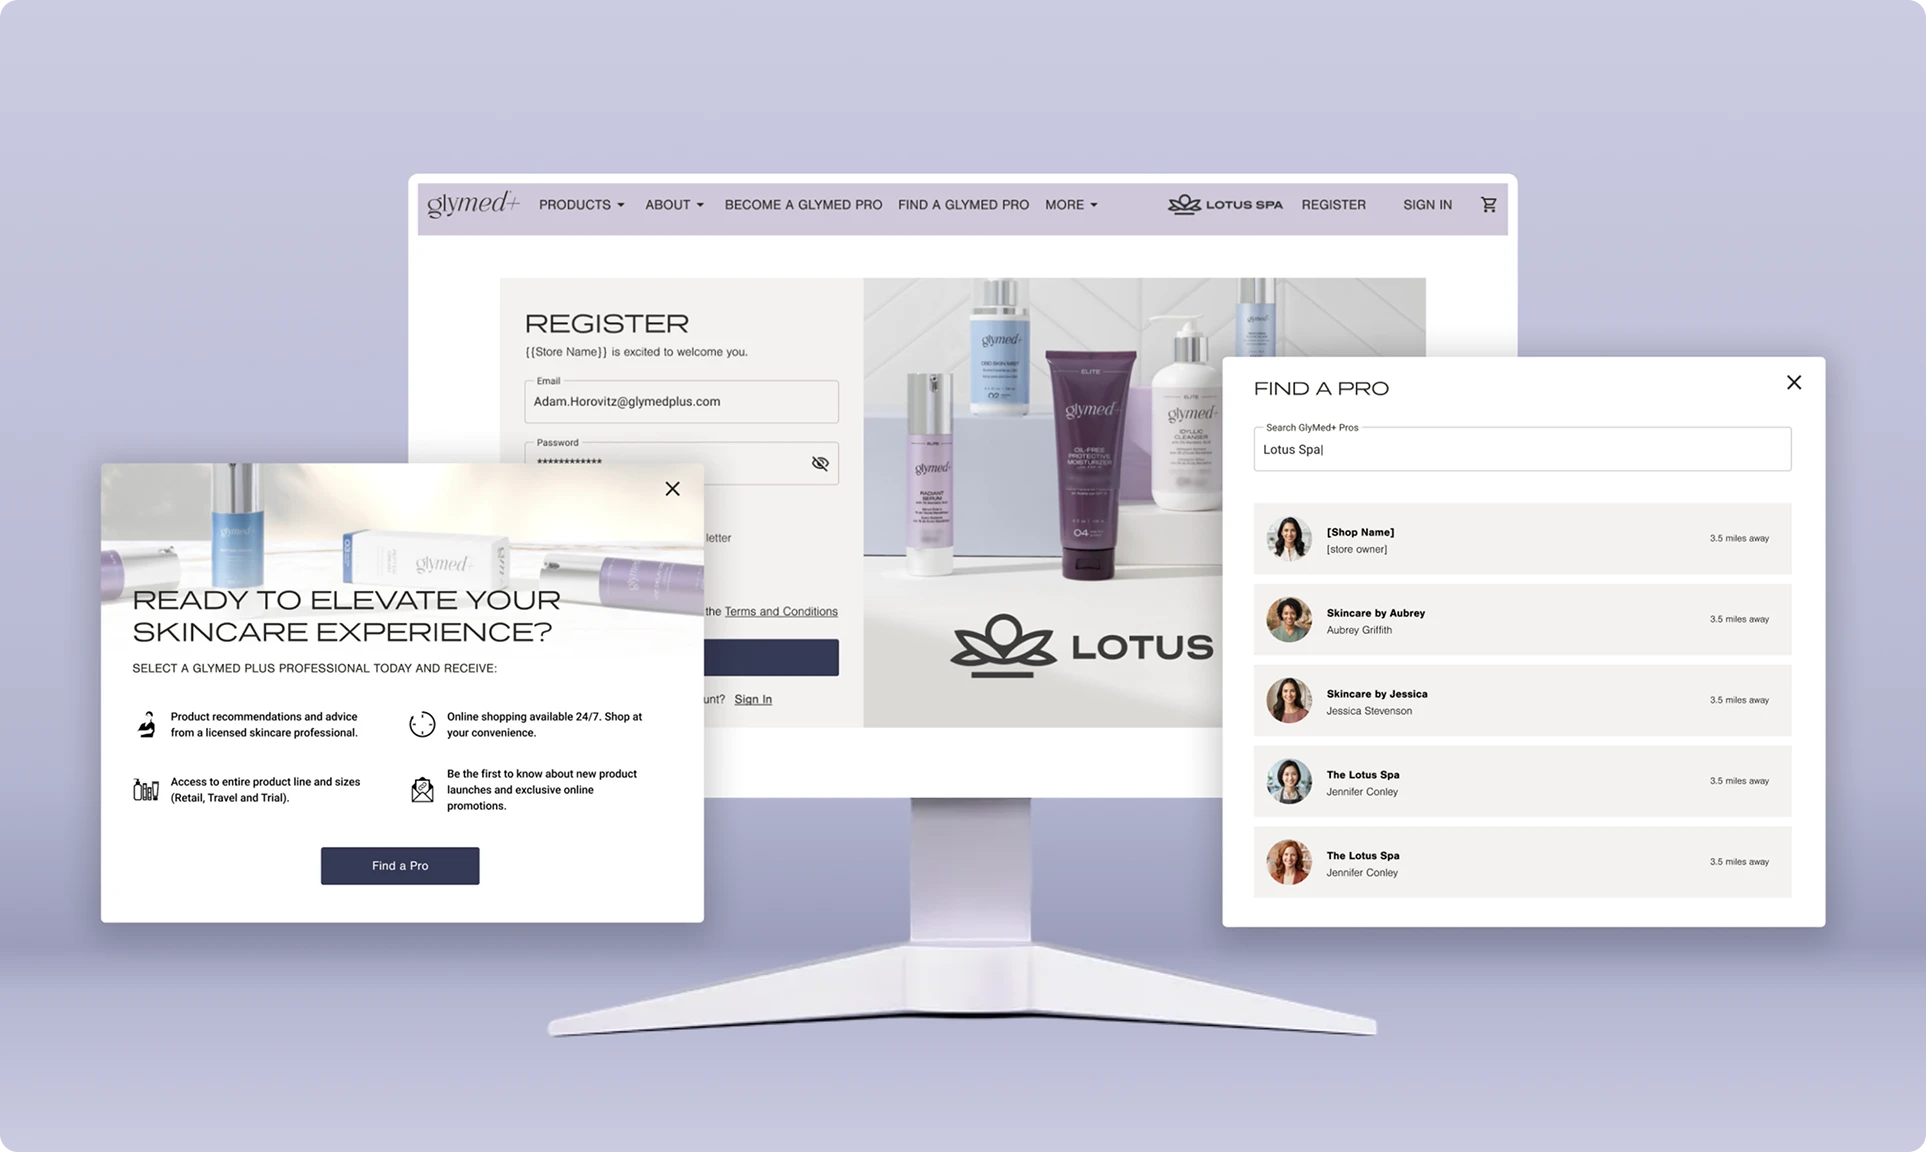
Glymed+ highly recommends that all customers be associated with a distributor, so customers who came to Glymed+ without a recommendation were failing to understand why they needed one. So I focused on:
- Clear microcopy
- Distributor discovery
- Simplified flow
Ease of Ordering
Anonymous Cart & Simple Checkout
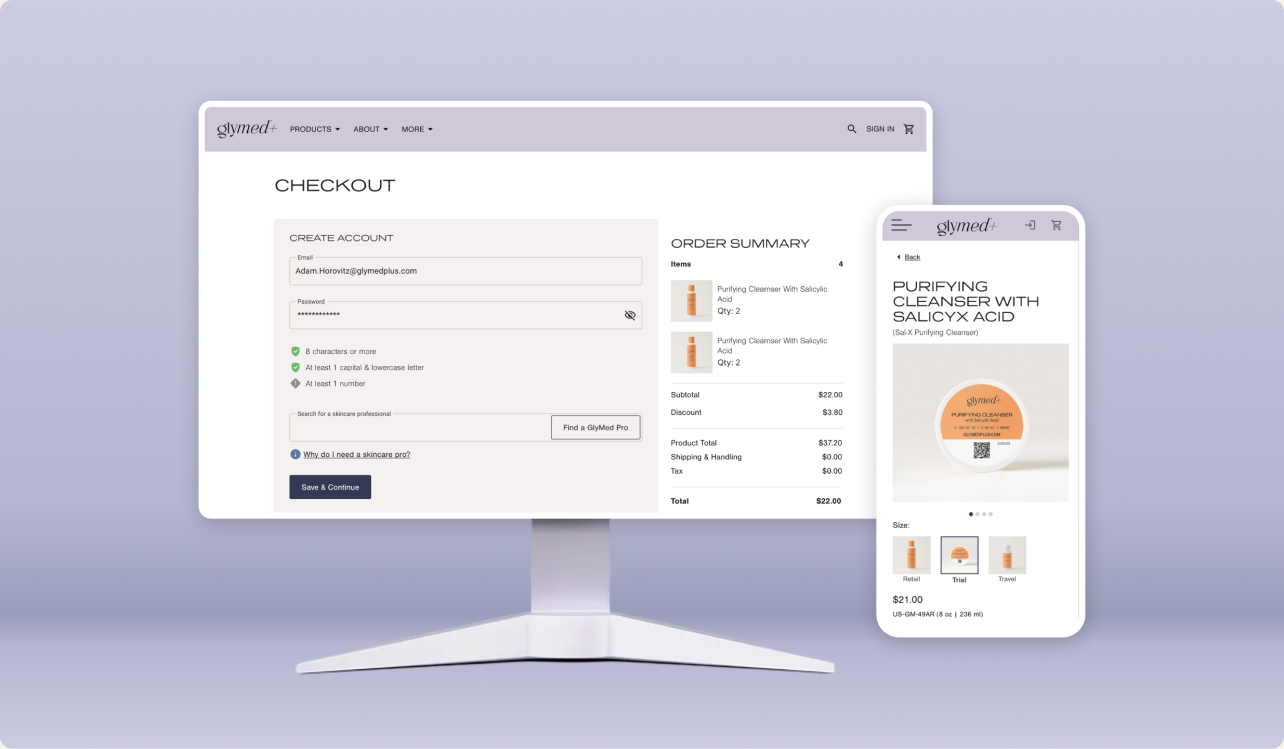
When auditing the checkout and signup flows, I discovered an opportunity to add anonymous checkout and cached carts for browsing customers. The product details page also had opportunities to increase clarity about the product and convert better.
Product Owner, Glymed+
“Being focused on those objectives, we’ve seen positive growth. More than we hoped for.”
Conclusion—Reflection
Since aligning on these objectives, we have implemented a few UI changes to improve these experiences. We have also implemented an A/B testing method through a CRO tool to identify the best solutions. We have already seen incremental improvements in bounce rates, cart abandonment, and user signups.
Product Framework
Successful Products Balance Needs
I frequently shared this Venn diagram. It shows how a good product team has three needs: User Needs, Business Needs, and Development Needs. The sweet spot is when all these needs converge. Product teams are successful when they work on things that solve problems for their users, help market the product, and are feasible.
Postscript—Surfacing Opportunities
While you hope every project creates positive change, improving one area often exposes a vulnerability in another. At Glymed+ we wanted to make it easier for customers to purchase on the site, and as we did, other challenges surfaced.
Security
Increased Fraudulent Orders
As we reduced friction in the signup flow, we saw an increase in fraudulent orders. These orders were being placed by bots and scammers. Engineering turned their focus toward this security issue once it was discovered, and orders were canceled.
Distribution Channels
Decrease in Distributor Satisfaction
Distributors get a portion of all sales that come through the Glymed+ site. So when they learned that anonymous orders could be placed, they were worried it would affect their sales numbers, since a new path for purchasing was introduced that did not require a distributor.